(773) 763-6750
<<< back< prevnext >
Religious Market Highlights 2020
Religious facilities are limited market, special use properties with widely varying characteristics. Nevertheless, transactions of religious properties show remarkable consistency over the last decade. Our 2020 edition of Religious Market Highlights compares market activity in 2019 to recent trends over the last five years and since 2009. [1]
Chicago Area Religious Facility Market Trends
|
|
|
|
|
| 2019 | Averages | ||
2015 | 2016 | 2017 | 2018 | 2019 | % Chg | 3-year | 5-year | 11-year | |
Transactions | 34 | 34 | 30 | 23 | 30 | 30% | 28 | 30 | 26 |
Total Dollar Volume (000s) | $22,179.0 | $32,367.4 | $27,417.2 | $23,159.0 | $33,260.5 | 44% | $27,945.6 | $27,676.6 | $22,120.1 |
Square Footage | 445,251 | 555,043 | 609,346 | 491,968 | 588,188 | 20% | 563,167 | 537,959 | 390,350 |
Weighted Average Price PSF | $49.81 | $58.32 | $44.99 | $47.07 | $56.55 | 20% | $49.54 | $51.35 | $59.58 |
Average Building Size | 10,611 | 12,284 | 13,650 | 14,000 | 14,442 | 3% | 14,031 | 12,997 | 11,269 |
Median Building Size | 12,619 | 15,411 | 17,851 | 20,819 | 18,336 | -12% | 19,002 | 17,007 | 13,730 |
Average Land/ Building Ratio | 4.86 | 3.52 | 9.05 | 9.04 | 5.38 | -40% | 7.82 | 6.37 | 5.58 |
Median Land/ Building Ratio | 2.78 | 2.02 | 4.61 | 1.86 | 2.08 | 12% | 2.85 | 2.67 | 2.49 |
Average Transaction Price PSF | $55.23 | $75.01 | $72.04 | $73.26 | $64.88 | -11% | $70.06 | $68.08 | $69.37 |
Median Price Per Square-foot | $52.04 | $59.30 | $54.83 | $40.67 | $64.58 | 59% | $53.36 | $54.28 | $58.37 |
Average Marketing Time | 396 | 331 | 501 | 691 | 454 | -34% | 548 | 474 | 387 |
Median Marketing Time | 264 | 169 | 328 | 442 | 318 | -28% | 363 | 304 | 255 |
Average Ask/ Sell Discount | -24% | -15% | -10% | -16% | -18% | 11% | -15% | -17% | -18% |
Median Ask/ Sell Discount | -18% | -12% | -10% | -10% | -14% | 35% | -11% | -13% | -14% |
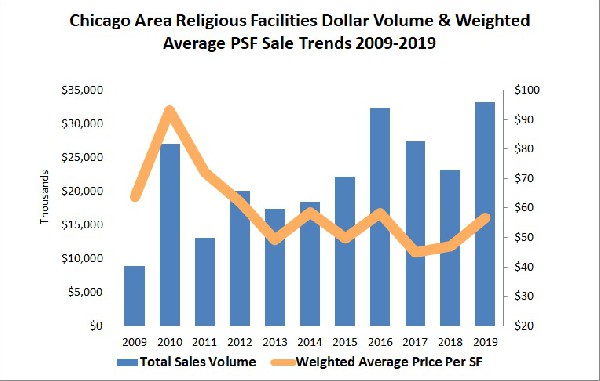
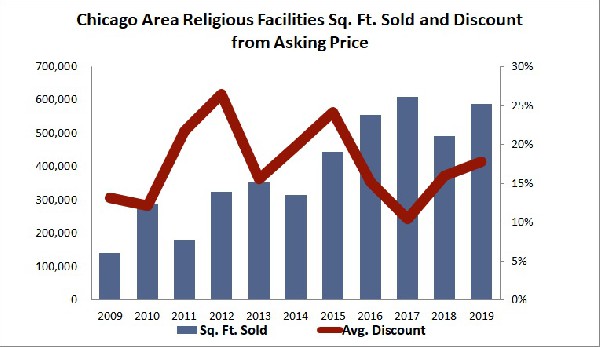
- The Chicago Commercial Appraisal Group, Ltd., has closely monitored and reported sales of religious facilities in the metropolitan Chicago area over the 11-year period since 2009. For the most part, the general market statistics over the last 3 to 5 years, are virtually indistinguishable when compared to the long-run trend since 2009. Notable exceptions are that dollar volume is trending upward as are the number of sales. Nevertheless, the overall trend in median price per square-foot is downward.
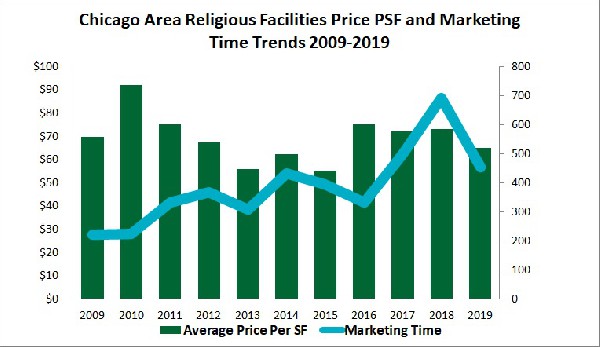
- Market activity was up sharply in 2019, with increases in the number of sales, overall dollar volume, square-footage sold, and price per square-foot compared to 2018. Marketing times were faster, but the spread between the asking price and ultimate sales price was higher. The average discount from the original asking price to the final sales price increased to 14% in 2019 from 10% in 2018, but is similar to the long-term trend.
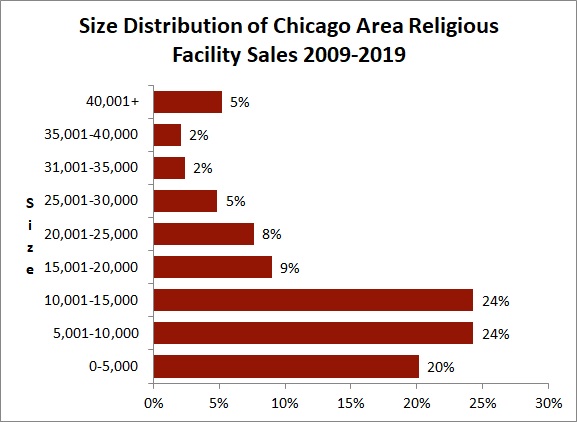
- The trend has been to larger building size, and although the median facility size in 2019 was smaller than in 2018, it is right in line with the upward trend observed since 2009.
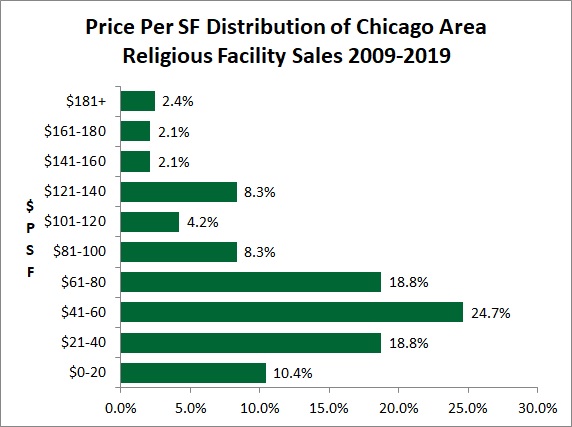
- Churches are small. Most sales since 2009 (68%) are under 15,000 square-feet. (The median is 14,631 square-feet). The median size of a religious property sold in 2019 was 25% larger than the overall median for the last 11 years.
- Since 2009, most properties (73%) sold for under $80 per square-foot. (The median was $57 per square-foot). Half were priced between $35 and $85 per square-foot.
- Notably, the average price per square-foot in 2019 was down 11% from 2018, and 6% below the 11-year average.
- The average age of a religious facility sold in 2019 was 66 years.
- After jumping to 15 months in 2018, average marketing time fell to 10 months in 2019, similar to the 5-year average.
- Of the 30 sales in 2019, 12 (40%) were in the city of Chicago vs. the suburbs. The city�™s market share has averaged 45% over the last 11 years.
[1] Based on analysis by the Chicago Commercial Appraisal Group, Ltd., of 288 religious facility sales in the metropolitan Chicago region since 2009 using data from CoStar/Comps, Inc., the MRED MLS and other sources.